

Stock Explorer
Overview:
Deep dive into individual stock fundamentals, performance, earnings, analyst estimates & ratings, news, company filings, insider transactions, and simple and advanced EPS calculators.
How to Use This Page:
This dataset provides a 360-degree view of the asset, bridging Fundamental Analysis (business health and fair value) with Technical Analysis (price trends and volatility), while also providing the Sentiment context needed to gauge market consensus.
Interacting with the Stock Explorer:
Overview: Concise Stock Information:
Fundamental Health & Profitability
Valuation Ratios
Technical & Momentum Indicators
Market Sentiment & Ownership
Event & Dividend Data
Quarterly Earnings: Graphed financial statements and financial ratios, see below for details.
Annual Earnings: Graphed financial statements and financial ratios, see below for details.
News: News that is ticker and sector specific.
Company Filings: Filter for a specific type of form you are looking for, such as an insider transaction, note offering, or stock offering. Direct links to form.
Insider Transactions:
Simple EPS Calculator:
Advanced EPS Calculator
Overview with NVDA Example:
🔑 Key Metrics
Market Cap: $4.54T
Latest Quarter: 2025-10-31
Diluted EPS (TTM): $4.05
Revenue (TTM): $187.142B
Profit Margin (TTM): 53.00%
Operating Margin (TTM): 63.20%
EBITDA: $112.696B
Gross Profit (TTM): $131.093B
📅 Upcoming Earnings Report
Date: 2026-02-25 (29 days away)
Status: Earnings Estimates Coming Soon!
💰 Valuation Metrics
P/E Ratio (Trailing): 46.04
P/E Ratio (Forward): 24.33
PEG Ratio: 0.70
Price/Sales (TTM): 24.26
Price/Book Ratio: 38.12
Book Value: $4.892
EV/Revenue: 23.95
EV/EBITDA: 37.64
📊 Growth & Profitability
Quarterly Earnings Growth YOY: 66.70%
Quarterly Revenue Growth YOY: 62.50%
Return on Equity (TTM): 107.40%
Return on Assets (TTM): 53.50%
💵 Dividend Information
Dividend Per Share: $0.04
Dividend Yield: 0.02%
Dividend Date: 2025-12-26
Ex-Dividend Date: 2025-12-04
💹 Price & Trading Information
52 Week High: $212.18
52 Week Low: $86.6
50-Day MA: $183.83
200-Day MA: $165.71
Beta: 2.31
Revenue Per Share (TTM): $7.67
Shares Outstanding: 24.305B
Shares Float: 23.331B
👥 Ownership Structure
Insider Ownership: 4.33%
Institutional Ownership: 69.47%
⭐ Analyst Ratings
Analyst Target Price: $253.19
Analyst Consensus: 93.8% Buy/Strong Buy (64 total ratings)
🟢 Strong Buy: 11
🟡 Buy: 49
⚪ Hold: 3
🟠 Sell: 1
🔴 Strong Sell: 0
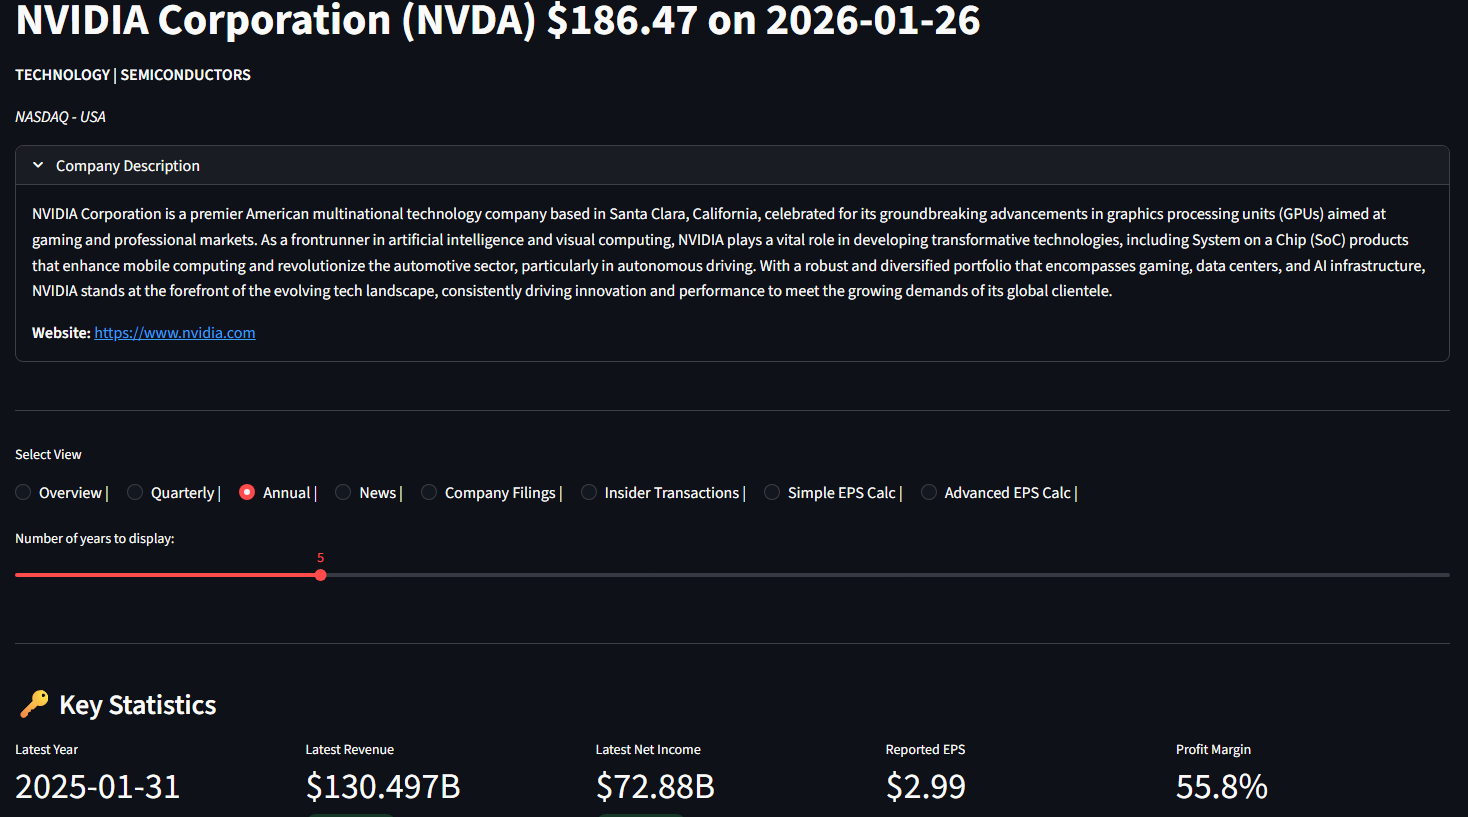
NVDA Overview Page (TOP), all companies have a brief description in the stock explorer.
Quarterly & Annual Earnings:
Graphed Quarterly and Annual Earnings Financial Statements:
Income Statement
Balance Sheet
Statement of Cash Flow
Statement of Equity
Financial Metric Ratios
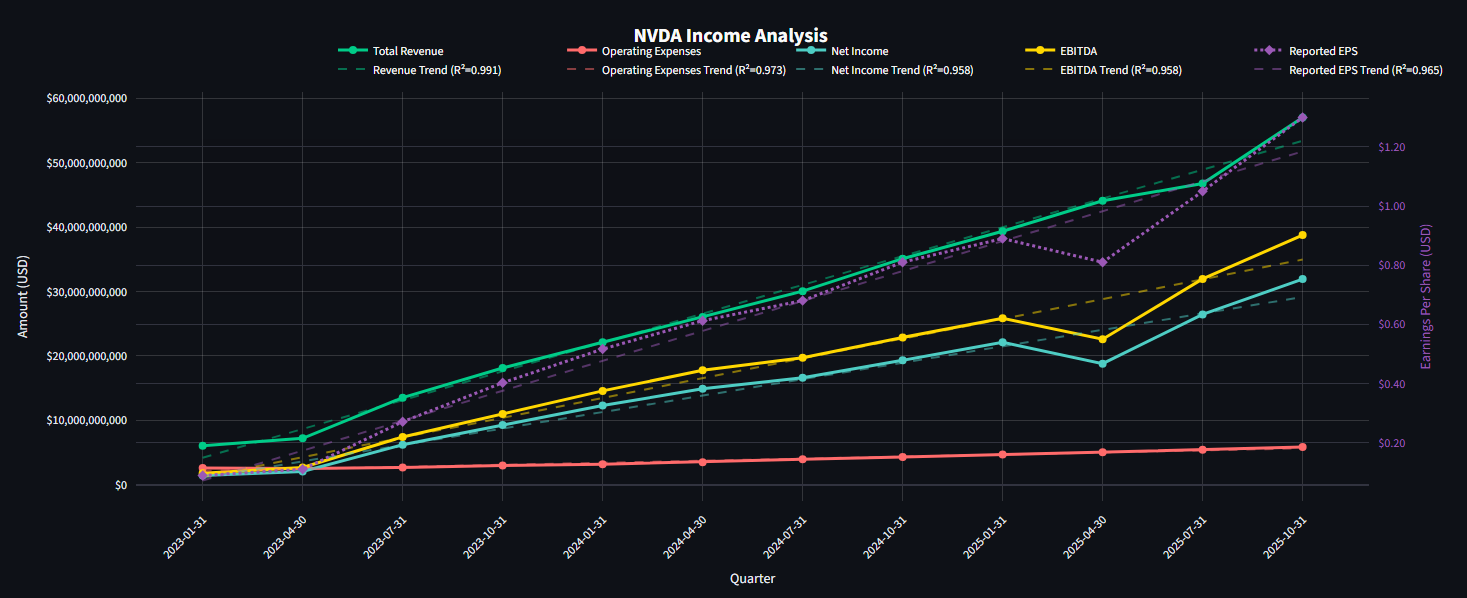
NVDA Income Statement with Trend lines
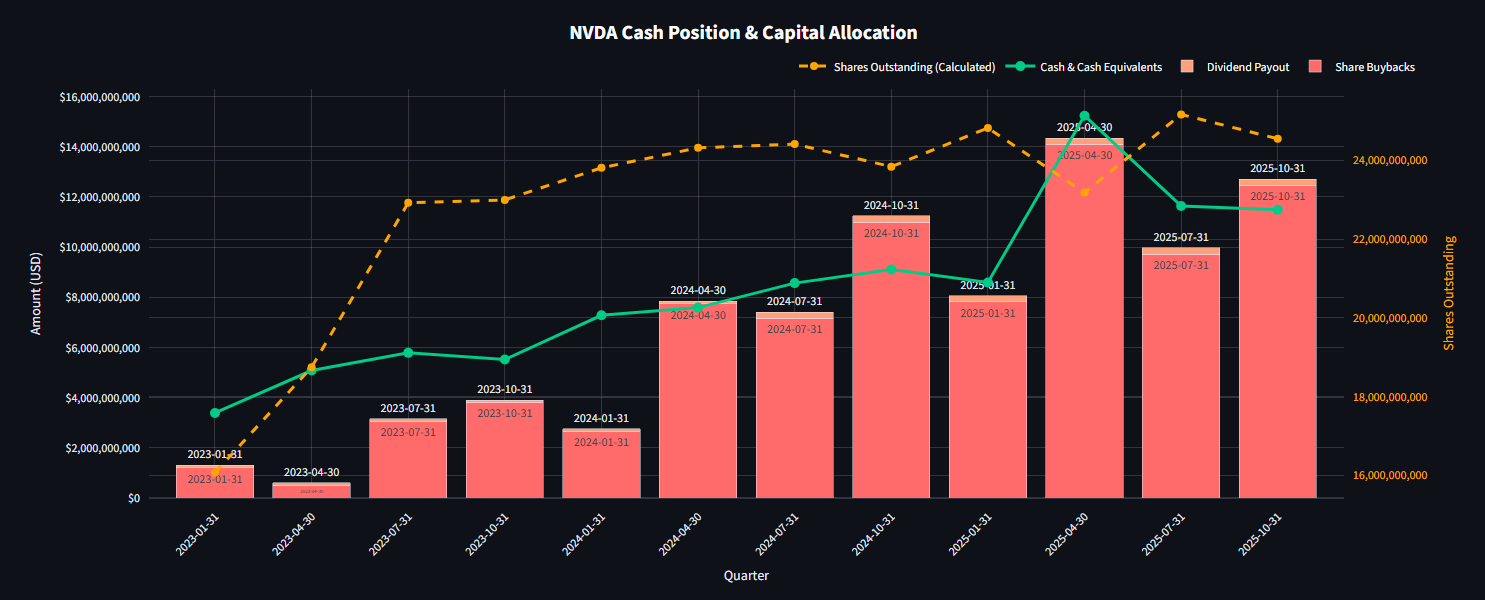
NVDA Cash, Share BuyBacks, Dividends, and Shares Outstandstanding
News:
News That is Ticker and Sector Specific:
Live news feed from various web sources
Company Filings:
Ticker Specific:
Filter for a specific type of form you are looking for, such as an insider transaction, note offering, or stock offering.
Direct links to the form itself.
Insider Transactions:
Insider Acquired and Sold Shares:
Monthly bar graph that shows the transactional value of shares acquired or sold.
Insider transaction table that quickly shows:
When the transaction occurred
Who in the company performed the transaction
Their name and title
If shares were acquired or sold
The total number of shares in the transaction
The dollar value of the transaction
NVDA 12 month Insider Transaction Timeline Graph
NVDA Insider Transaction Grid
Simple EPS Calculations:
View and Create your own EPS, PE, Price Target Calculation:
Static Calculation
Current Calculation
This calculation displays the company's current earnings per share based on the latest stock price and trailing twelve-month P/E ratio.
It represents the actual EPS the company has generated over the past year.
Target Calculation
This calculation shows the earnings required to reach the analyst price target while maintaining the current trailing P/E ratio.
It assumes the valuation multiple stays constant, revealing what EPS growth is needed to justify the target price.
Forward Calculations
This calculation uses the forward P/E ratio to estimate future earnings potential.
It shows what the company's EPS needs to be over the next 12 months to justify reaching the analyst price target.
A lower forward P/E compared to the trailing P/E suggests the market expects earnings growth.
EPS Sandbox
Calculate Stock Price
Enter P/E and EPS to calculate the implied stock price.
Calculate P/E Ratio
Enter Stock Price and EPS to calculate the P/E ratio you believe is a fair valuation for the stock.
Calculate EPS
Enter Stock Price and P/E to calculate required EPS to reach your predicted stock price.
Showcase of how to use the simple EPS calculator to input your predictions of a stocks price target, and what combination earnings and PE Ratio are needed to achieve that price target.
Advanced EPS Calculations:
Insider Acquired and Sold Shares:
Use Historical and Forward looking EPS, Growth %, TTM EPS, and stock prices to
User Inputs:
PE Forecast
Number of historical quarters to display
Number of forecast quarters to display
Quarterly Growth Rate %
4 individual inputs for the next 4 quarters
Historical Information:
EPS
Earnings Growth %
Average stock price in previous quarter